HR Analytics
HR teams need to see where attrition is concentrated and which parts of the workforce need attention. This project turns raw employee data into a multi-page Power BI dashboard that answers exactly that.
- 01
Objective
HR teams need a clear view of their workforce: how many people are employed, where attrition is concentrated, and which departments or roles need attention. This project turns raw employee data into a multi-page Power BI dashboard that puts those answers in one place.
- 02
Tools & Technologies
Power BI, Power Query, DAX, Data Modeling, Data Visualization.
- 03
Analysis Process
The HR dataset was cleaned and shaped in Power Query, then structured into a data model in Power BI. I created DAX measures for HR KPIs such as headcount, attrition rate, and review dates, and organized the report into four pages — Overview, Demographics, Performance Tracker, and Attrition — so each area of the workforce can be explored on its own.
- 04
Dashboard Preview
The Atlas HR dashboard is split into four pages. Overview summarizes headcount and attrition with hiring trends and department breakdowns; Demographics covers age, gender, ethnicity, marital status, and salary; Performance Tracker follows satisfaction and rating history for a selected employee; Attrition breaks attrition down by department, job role, tenure, hire date, travel frequency, and overtime.
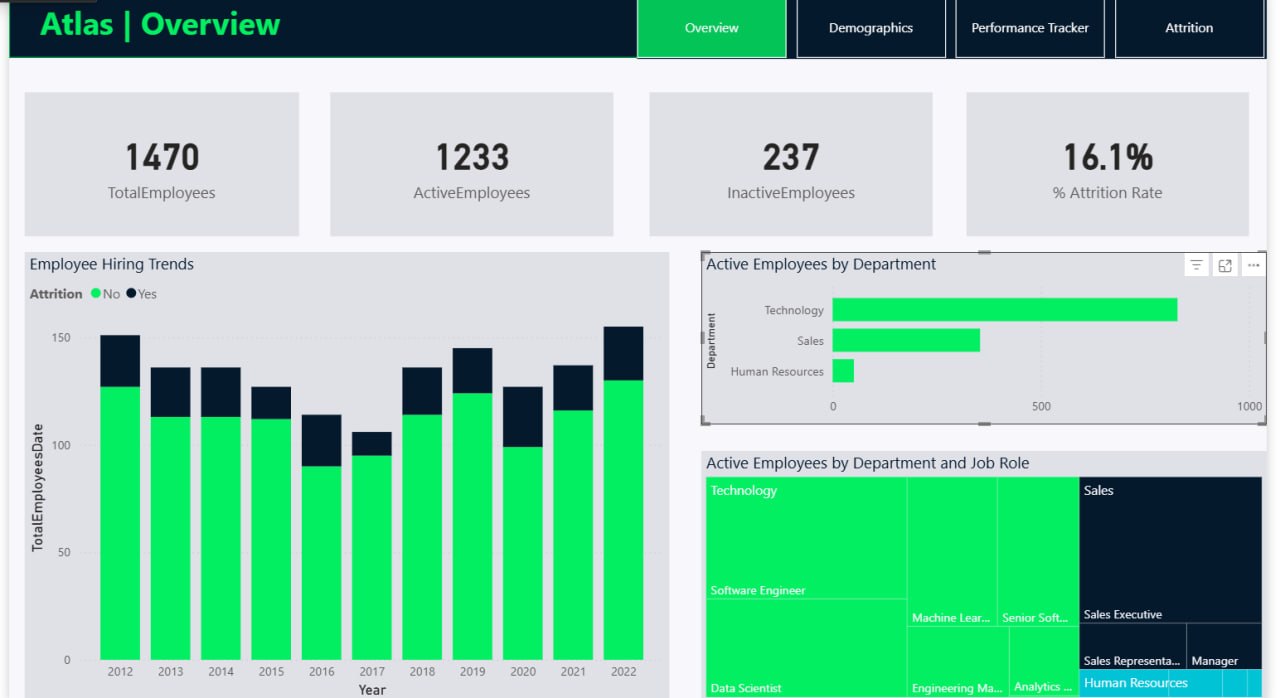
Overview — headcount, attrition rate, hiring trends and departments. 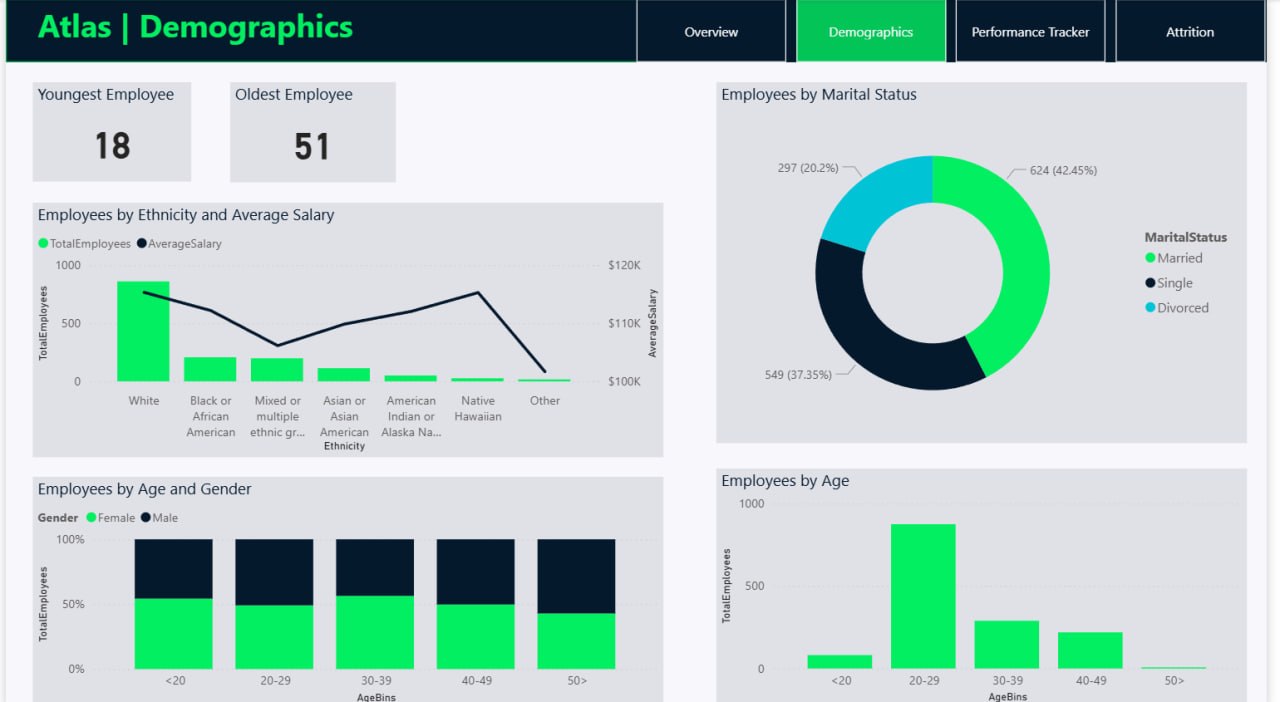
Demographics — age, gender, ethnicity, marital status and salary. 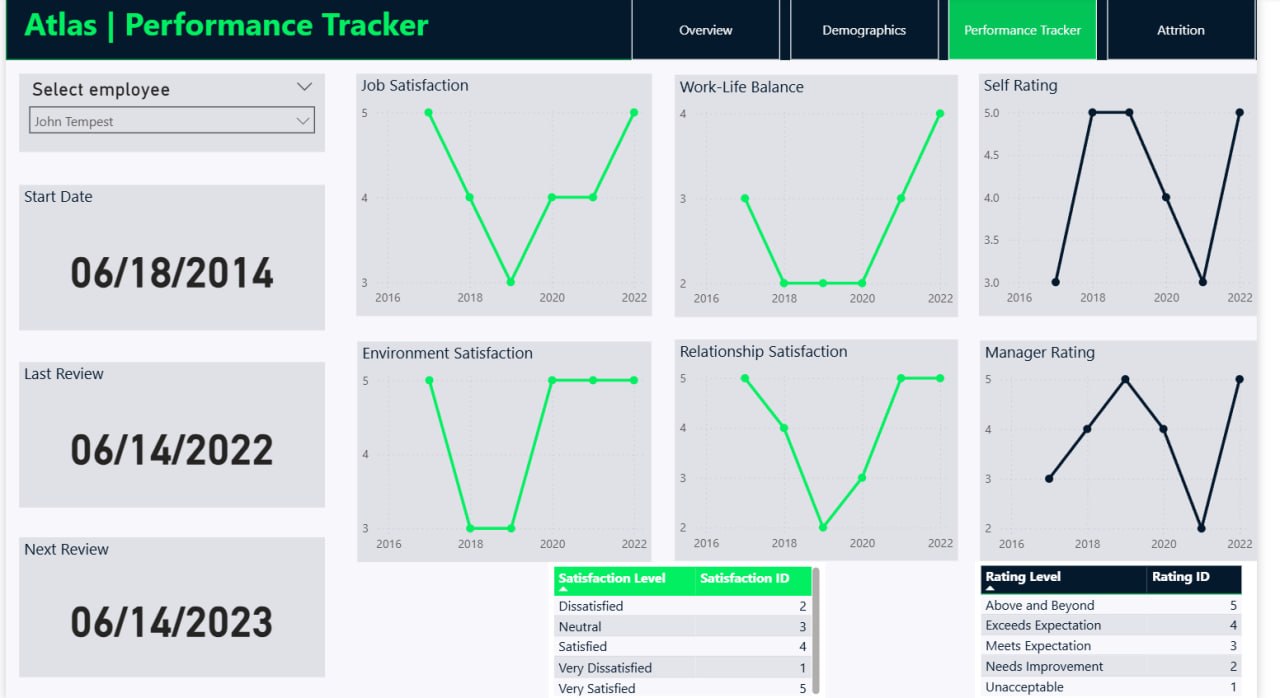
Performance Tracker — satisfaction and rating history per employee. 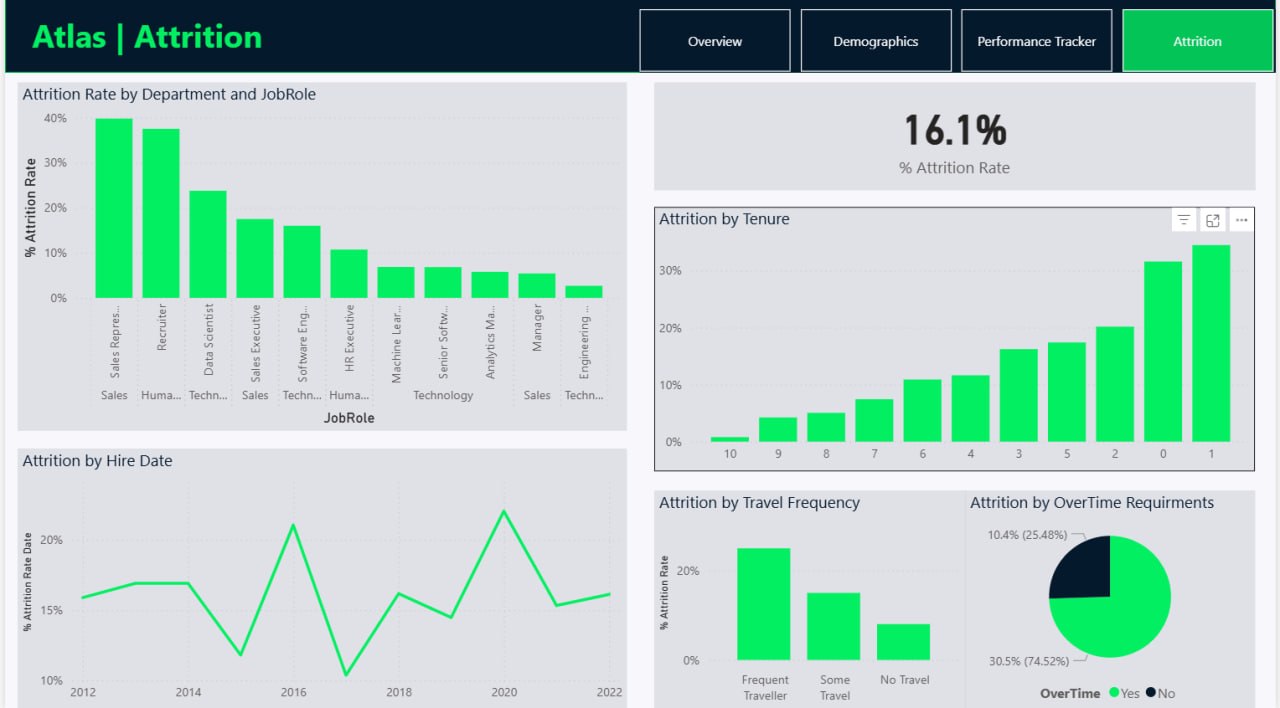
Attrition — by department, job role, tenure, travel and overtime. - 05
Key Insights
The report supports a clearer understanding of workforce composition and the factors that sit alongside attrition. It makes it possible to compare departments and job roles, follow hiring and attrition over time, look at demographic and salary distributions, and review individual performance history in one place.
- 06
Project Outcome
This project demonstrates the ability to work with employee data end-to-end in Power BI, from data preparation in Power Query through data modeling, DAX measures, and multi-page dashboard design.
- 07
Project Links