Sales Data Analysis: Customer, Product & Revenue Insights
A retail business needed to know where its revenue actually comes from — which products, customers, markets, and months drive sales. This Python analysis answers that and turns the findings into concrete recommendations.
- 01
Overview
A retail business needed to understand where its revenue actually comes from: which products sell best, which customers spend the most, which markets perform strongest, and how sales move across the year. This Python-based analysis answers those questions and turns the findings into recommendations the business can act on.
- 02
Tools & Technologies
Python • Pandas • Matplotlib • Jupyter Notebook • VS Code
- 03
Analysis
- Sales Overview: Analyzed key sales and business metrics. - Product Analysis: Compared top products by quantity and revenue. - Customer Analysis: Identified top-spending and repeat customers. - Country Analysis: Compared sales across different markets. - Monthly Trends: Analyzed sales fluctuations throughout the available period.
- 04
Analysis Output
The analysis runs in a Jupyter notebook using Pandas and Matplotlib. The outputs below summarize the dataset and show the monthly sales trend and the top 5 products by sales.
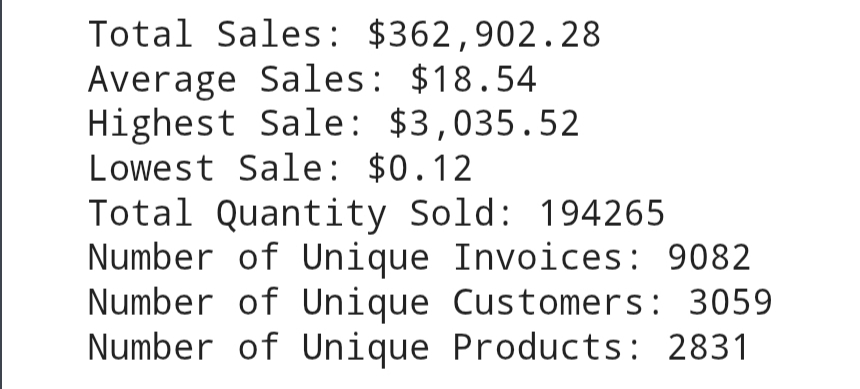
Dataset summary — total sales, quantity sold, invoices, customers and products. 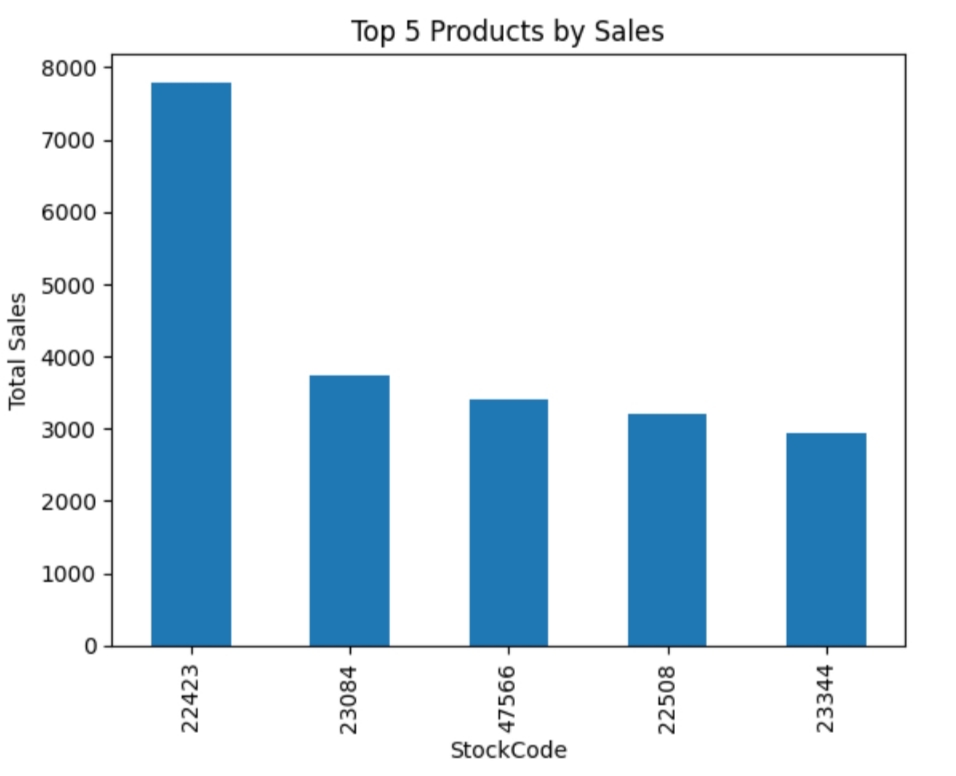
Top 5 products by sales. 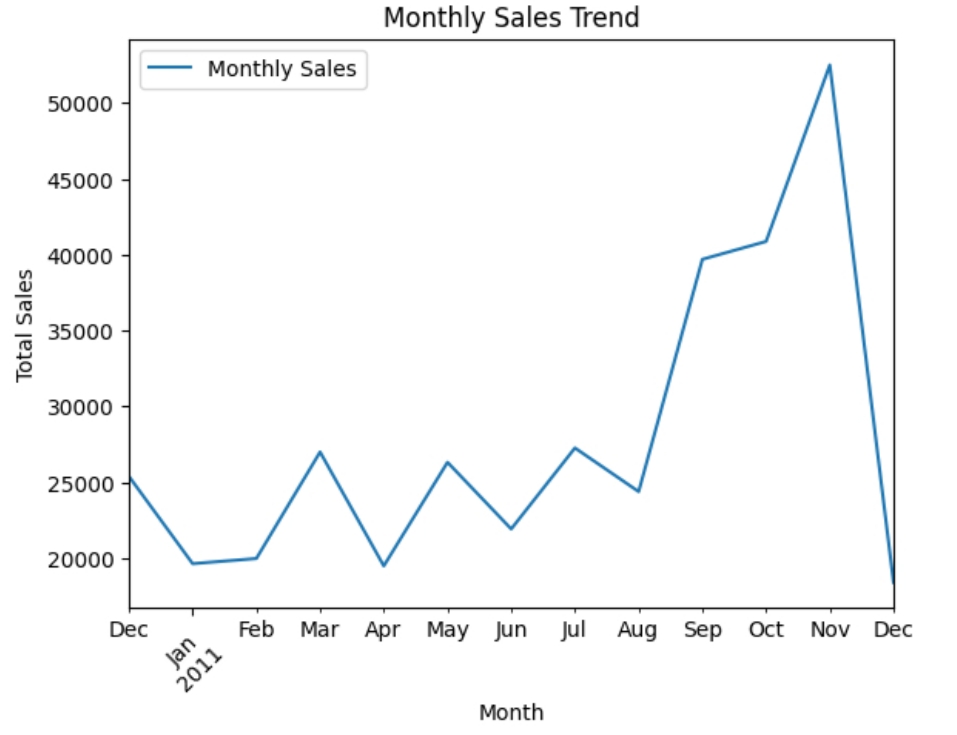
Monthly sales trend — sales peak in November 2011. - 05
Key Insights
- The dataset covers $362,902.28 in total sales across 9,082 invoices, 3,059 customers, and 2,831 unique products. - Revenue leaders differed from the most frequently purchased products — product 22423 led sales by a wide margin. - The UK generated more than 15× the sales of the Netherlands. - November 2011 was the highest-sales month, with sales peaking well above the rest of the year. - Sales fluctuated significantly across the analyzed period.
- 06
Recommendations
- Focus marketing efforts on the UK market. - Maintain sufficient stock of high-revenue products. - Investigate low-performing months. - Review the profitability of lower-performing markets.
- 07
Project Outcome
Strengthened my practical skills in Python, Pandas, data visualization, exploratory data analysis, and turning data into actionable business insights.
- 08
Project Links